|
|
 
Chaos and Weather |
|
|
 
Chaos and Weather |
|
Chaos is the study of unpredictability. What makes things hard to predict? What can we say about systems we can't predict? Let's start off by looking at the weather. Now, you may think it's hard to predict weather because weather systems are so vast; that is to say, you may think that difficulty in weather prediction stems from lack of information. This is not the case. Even if we had all the information we could want, we would not be able to form accurate long-term weather predictions. This is because weather systems display sensitivity to their initial conditions. What does this mean? It means that a tiny, tiny change in the initial state of a weather system can have a huge, disproportionate effect on the whole system. You may have heard of the butterfly flapping its wings in the Far East, and a storm arising in the United States. This is an example of sensitive dependence on initial conditions: the almost impercetible change caused by the flapping of the butterfly's wings causes massive changes in the eventual overall behavior of the system. Sensitive dependence on initial conditions is one of the hallmarks of chaos. Indeed, you won't find one without the other. The first person to investigate this sort of behavior was Edward Lorenz, an American meteorologist. He invented the butterfly's wings example. Read more about Lorenz at the excellent Chaos Introduction site. Here are two projects which should help to show you the difficulties of prediction in chaotic systems: Let me repeat: it is not necessarily the size of the system which makes for chaotic behavior. Interesting mathematical examples can be developed from seemingly simple equations. One way mathematicians investigate this kind of behavior is by iterating functions. Remember, a function is a "machine" or set of rules for turning one number into another (if you'd like more information on functions check out the Analysis page). To iterate a function, you start with some specific initial value and feed it into the function, generating a second number. Feed this new number into the function. This generates a third number. Now repeat this procedure, always using the last output value as the next input value. This process creates a dynamical system: a system which depends on time. Here is an easy example. Suppose our function is f(x)=3x+4and our initial value is 0. Feeding 0 into f gives f(0)=3(0)+4=4We can continue, generating more and more iterations: f(4)=3(4)+4=16and so on. This example is not chaotic. Indeed, it is very simple. If your initial value is any positive number, its orbit (the sequence of numbers generated by iteration) will tend toward infinity (that is to say that the numbers in the sequence will grow bigger and bigger). What happens if your initial value is negative? (Hint: you may want to consider two cases. Different things happen depending whether or not your initial negative number is bigger or smaller than -2. Why -2?) Most importantly, this dynamical system does not have sensitivity to initial conditions. If you start with two initial values which are "close together", there orbits will stay "close together". (Notice that this does not necessarily happen to points around one specific number. Which number? For a dynamical system to be sensitive to initial conditions any two points which start off close together must have orbits which do not stay close.) There is a very nice graphical representation of function iteration. On the same set of axes, draw the function which you are iterating and also the identity function I(x)=x. This is what the picture would look like for our example.
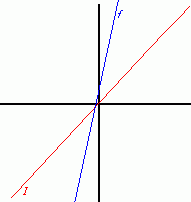
Now draw a vertical line from the initial value on the x-axis to the function. For the initial value 4 you should get:
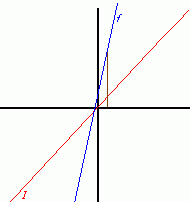
Next, draw a horizontal line from the the function to the identity:
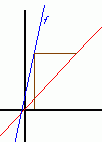
Now draw a vertical line back to the function:
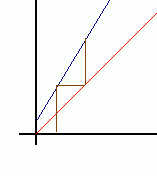
and then a horiztonal line to the identity:
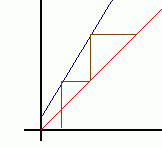
Repeating this process generates the following picture:
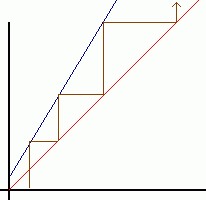
See how the orbit escapes to infinity? Make sure you understand how this process works. Does it help to explain why you needed to consider -2 as a special case? (Use the same process to draw the orbits of -1 and -3.) Using the picture you should be able to find the orbit of any point. Now that you understand the method and the terminology, try a more complicated example. Suppose f(x)= -4x² + 4x
Another amazing things about chaos is that, despite the difficulties of prediction, patterns and order can sometimes emerge from chaotic behavior. To get a feel for this, you can play the Chaos Game hosted by the Shodor Education Foundation. If you'd like to read more about Chaos, the best (and most famous) book is James Gleick's Chaos: Making a New Science. Check it out at Amazon. You can also check out the Santa Fe Institute where they study chaos and complexity.

|