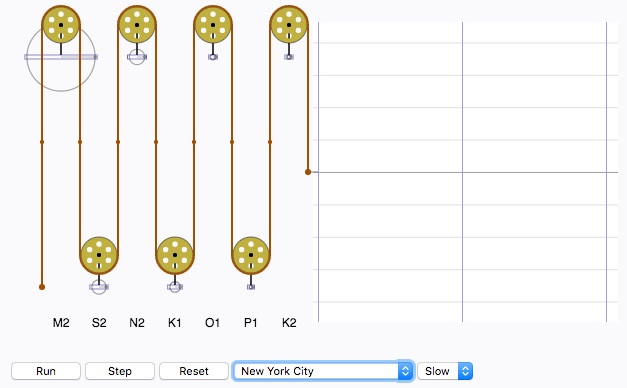
In this simulation the constituents all start out in phase; the typical aspect of the tidal record for the port does not appear until after a simulated week or two.
The following constituent amplitudes were used in the simulation:
                              M2     S2    N2    K1    O1    P1    K2
Matarani, Peru               0.995 0.274 0.225 0.514 0.279 0.167 0.101 ft
Yamato Wan, Kuril Islands    0.59  0.23  0.11  0.95  0.79  0.31  0.06
New York NY                  2.104 0.437 0.469 0.321 0.170 0.104 0.127
Otomari, Sakhalin Island     0.656 0.312 0.102 0.719 0.715 0.240 0.095
Cordova, Alaska              4.712 1.599 0.957 1.615 1.001 0.530 0.463
Ras at Tannura, Saudi Arabia 1.951 0.651 0.416 0.471 0.380 0.142 0.231
Recife, Brazil               76.2  27.5  5.3   4.3   5.0  1.4    8.1  cm
Clicking on the hyperlinked ports will bring up AU audio files, interpreting the times and heights of high and low tides for each port as the notes of a musical score. The musical patterns were generated by Stephanie Mason at the University of Minnesota Geometry Center, who wrote C-code to generate predicted tides for these ports, and programmed a NeXT-MIDI interface to generate the corresponding soundtracks. Each second of the score encompasses about 24 hours of the tidal record; each excerpt is about 30s long and takes up about 240K. Additional tidal music is available at Tidesounds.
The constituent amplitudes for Recife are courtesy of the Banco Nacional de Datos Oceanográficos, Diretoria de Hidrografia e Navigação, Marinha do Brasil. Other amplitudes courtesy of the National Ocean Service, thanks to Tom Kendricks.
JAVA simulation of Kelvin's Tide Predicting Machine
|
|
|
© Copyright 2001, American Mathematical Society |