08-02-14.mw
| > |
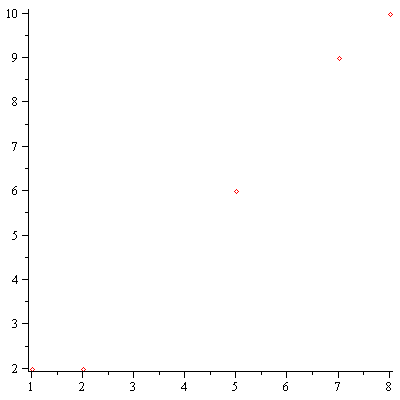
data:=[[1,2], [2,2], [5,6], [7,9], [8,10]]; |
![[[1, 2], [2, 2], [5, 6], [7, 9], [8, 10]]](images/08-02-14_1.gif) |
(1) |
| > |
plot(data,style=point); |
How far away is y=x+1.2 from this data? need some idea of distance(line, data)
bad idea: sum of differences in y values
 |
(2) |
 |
(3) |
 |
(4) |
 |
(5) |
can reference elements in a list using []
![[[1, 2], [2, 2], [5, 6], [7, 9], [8, 10]]](images/08-02-14_7.gif) |
(6) |
![[5, 6]](images/08-02-14_8.gif) |
(7) |
 |
(8) |
 |
(9) |
 |
(10) |
| > |
f(data[3][1])-data[3][2]; |
 |
(11) |
| > |
seq( f(data[i][1])-data[i][2], i=1..5); |
 |
(12) |
| > |
sum( f(data[i][1])-data[i][2], i=1..5); |
 |
(13) |
 |
(14) |
| > |
sum( h(data[i][1])-data[i][2], i=1..5);
seq( h(data[i][1])-data[i][2], i=1..5); |
 |
 |
(15) |
Bad, gives 0 when fit isn't perfect.
next try, consider sum(absvalue)
| > |
sum( abs(h(data[i][1])-data[i][2]), i=1..5); |
 |
(16) |
| > |
sum( abs(f(data[i][1])-data[i][2]), i=1..5); |
 |
(17) |
want to write a function that gives me abs difference between f and a point. This is |f(p_x) - p_y|
| > |
err := (f, p) -> abs( f(p[1]) - p[2]); |
![proc (f, p) options operator, arrow; abs(`+`(f(p[1]), `-`(p[2]))) end proc](images/08-02-14_20.gif) |
(18) |
 |
(19) |
 |
(20) |
Note that garbage in gives a garbage answer.
![abs(`+`(7[2], `-`(3)))](images/08-02-14_23.gif) |
(21) |
now distance is the sum of the errors
 |
(22) |
| > |
nops( {1, 2,3,4,5,6,7}); |
 |
(23) |
 |
(24) |
| > |
sum( abs(h(data[i][1])-data[i][2]), i=1..nops(data)); |
 |
(25) |
| > |
sum( err(h,data[i]), i=1..nops(data)); |
 |
(26) |
| > |
dist:= h-> sum( err(h,data[i]), i=1..nops(data)); |
![proc (h) options operator, arrow; sum(err(h, data[i]), i = 1 .. nops(data)) end proc](images/08-02-14_29.gif) |
(27) |
 |
(28) |
 |
(29) |
 |
 |
(30) |
 |
(31) |
Try distance for various lines of slope 1, varying intercept.
You should think about how to do this, and we'll go over it next week.
