08-02-07.mw
I forgot to save the worksheet on this day, so I'm trying to recreate it from memory. Sorry about that. Here goes:
First, we were talking about lists and sets and data and points and so on. Sets are surrounded by {} braces and have no inherent order. A list is surrounded by [] and has a fixed order.
 |
(1) |
![[1, 5, 4]](images/08-02-07_2.gif) |
(2) |
Both lists and sets can have anything inside them, including another set or list:
| > |
{ 1, [4,5], 2, {3}, apple}; |
![{1, 2, [4, 5], {3}, apple}](images/08-02-07_3.gif) |
(3) |
We can represent a point in the plane as a pair of numbers. Here we have a list of points:
| > |
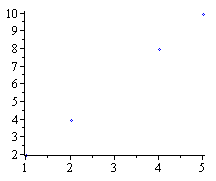
data := [ [1,2], [2,4], [4,8], [5,10]]; |
![[[1, 2], [2, 4], [4, 8], [5, 10]]](images/08-02-07_4.gif) |
(4) |
| > |
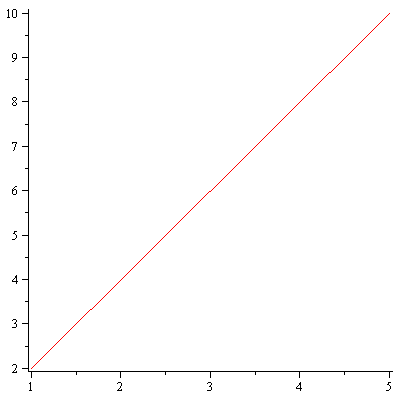
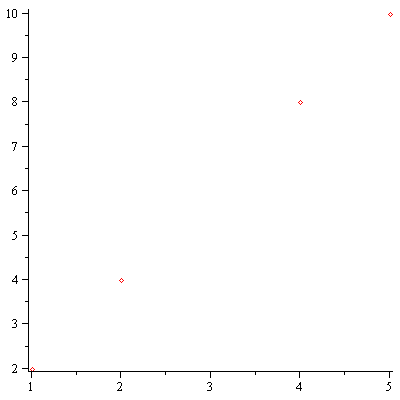
plot(data,style=point); |
| > |
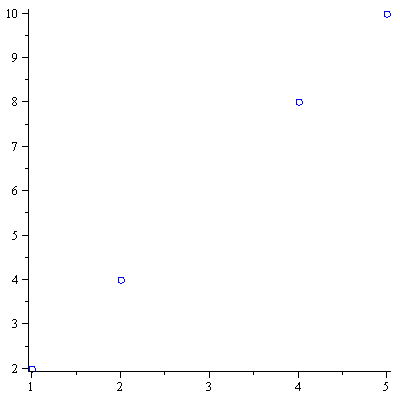
plot(data,style=point,symbolsize=15,symbol=circle,color=blue); |
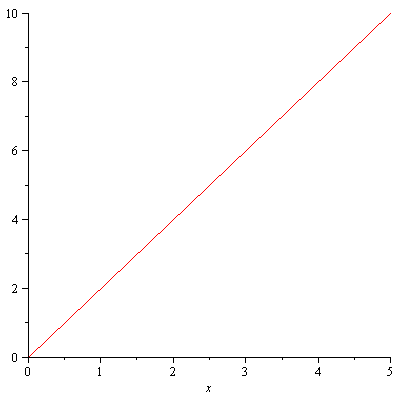
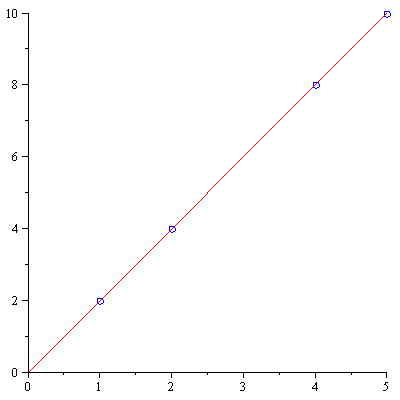
We'd like to see both the line and the points on the same graph. We can do this by assigning the plots to a variable, and then using the display command from the plots library to show them on the same plot.
| > |
linepic:=plot(2*x,x=0..5):
pointpic:=plot(data,style=point,symbolsize=15,symbol=circle,color=blue): |
| > |
plots[display]({linepic,pointpic}); |
Let's generate some data, and let maple find the appropriate line for us. We'll use the seq command, so first let's play with the command itself.
 |
(5) |
![[1, 1], [2, 4], [3, 9], [4, 16], [5, 25]](images/08-02-07_12.gif) |
(6) |
Now let's make some points on the line y=x/2
| > |
pts:=[seq([x,x/2],x=0..10)]; |
![[[0, 0], [1, `/`(1, 2)], [2, 1], [3, `/`(3, 2)], [4, 2], [5, `/`(5, 2)], [6, 3], [7, `/`(7, 2)], [8, 4], [9, `/`(9, 2)], [10, 5]]](images/08-02-07_13.gif) |
(7) |
![[BSpline, BSplineCurve, Interactive, LeastSquares, PolynomialInterpolation, RationalInterpolation, Spline, ThieleInterpolation]](images/08-02-07_14.gif)
![[BSpline, BSplineCurve, Interactive, LeastSquares, PolynomialInterpolation, RationalInterpolation, Spline, ThieleInterpolation]](images/08-02-07_15.gif) |
(8) |
| > |
PolynomialInterpolation(pts,x); |
 |
(9) |
| > |
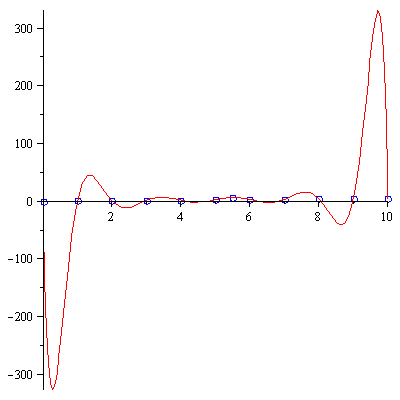
pts2:=[seq([x,x/2],x=0..5),[5.5,6.5],seq([x,x/2],x=6..10)]; |
![[[0, 0], [1, `/`(1, 2)], [2, 1], [3, `/`(3, 2)], [4, 2], [5, `/`(5, 2)], [5.5, 6.5], [6, 3], [7, `/`(7, 2)], [8, 4], [9, `/`(9, 2)], [10, 5]]](images/08-02-07_17.gif) |
(10) |
| > |
PolynomialInterpolation(pts2,x); |

 |
(11) |
| > |
display(
[plot(pts2,style=point,symbolsize=15,symbol=circle,color=blue),
plot(PolynomialInterpolation(pts2,x),x=0..10)]); |
| > |
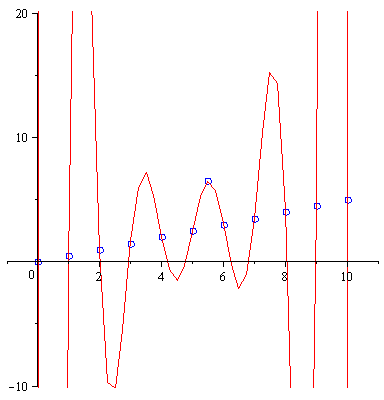
display(
[plot(pts2,style=point,symbolsize=15,symbol=circle,color=blue),
plot(PolynomialInterpolation(pts2,x),x=-1..11,y=-10..20)]); |
