| > | with(DEtools): |
| > | phug:= [ diff(theta(t),t) = ( v(t)^2 - cos(theta(t))) / v(t),
diff(v(t),t) = -sin(theta(t)) - R*v(t)^2 ]; |
| > |
| (1) |
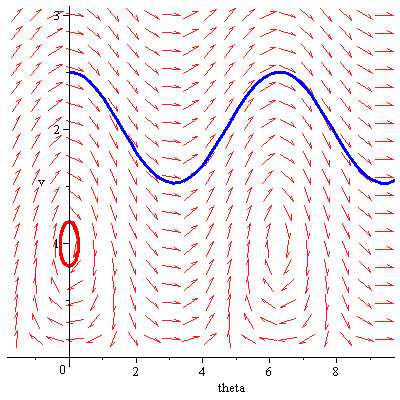
| > | R:=0;
DEplot(phug, [ theta(t), v(t) ], t=0..40, |
| > | [[theta(0)=0, v(0)=2.5], [theta(0)=0, v(0)=.8]], |
| > | theta=-Pi/2..3*Pi, v=0..3, |
| > | linecolor=[blue,red], stepsize=0.1);
phase:=%: |
 |
| > |
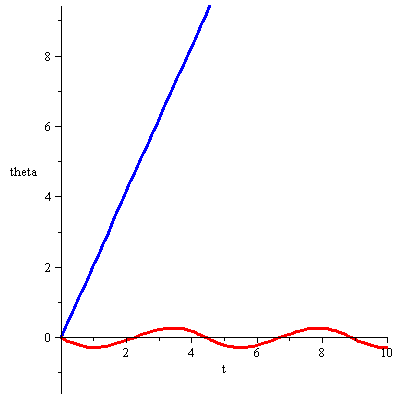
| > | DEplot(phug, [ theta(t), v(t) ], t=0..10, |
| > | [[theta(0)=0, v(0)=2.5], [theta(0)=0, v(0)=.8]], |
| > | theta=-Pi/2..3*Pi, v=0..3,
scene=[t,theta], |
| > | linecolor=[blue,red], stepsize=0.1);
thetaplot:=%: |
| > |
 |
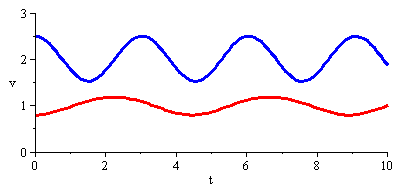
| > | DEplot(phug, [ theta(t), v(t) ], t=0..10, |
| > | [[theta(0)=0, v(0)=2.5], [theta(0)=0, v(0)=.8]], |
| > | theta=-Pi/2..3*Pi, v=0..3,
scene=[t,v], |
| > | linecolor=[blue,red], stepsize=0.1);
vplot:=%: |
| > |
| > |
 |
| > | with(plots): |
| > | display( array ([ phase, thetaplot, vplot ])); |
|
| > | R:='R':
xphug:= [ diff(theta(t),t) = ( v(t)^2 - cos(theta(t))) / v(t), diff(v(t),t) = -sin(theta(t)) - R*v(t)^2 , diff(x(t),t) = v(t)*cos(theta(t)), diff(y(t),t) = v(t)*sin(theta(t))]; |
| (2) |
| > | R:=0;
display( array([ DEplot(xphug, [ theta(t), v(t), x(t), y(t) ], t=0..10, |
| > | [[theta(0)=0, v(0)=2.5, x(0)=0, y(0)=4 ],
[theta(0)=0, v(0)=.8, x(0)=0, y(0)=1 ]], |
| > | theta=-Pi/2..3*Pi, v=0..3, x=-1..6, y=0..7,
scene=[theta,v], |
| > | linecolor=[blue,red], stepsize=0.1, title="v,theta phase"),
|
| > | DEplot(xphug, [ theta(t), v(t), x(t), y(t) ], t=0..10, |
| > | [[theta(0)=0, v(0)=2.5, x(0)=0, y(0)=4 ],
[theta(0)=0, v(0)=.8, x(0)=0, y(0)=1 ]], |
| > | theta=-Pi/2..3*Pi, v=0..3, x=-1..6, y=0..7,
scene=[x,y], title="path of glider", |
| > | linecolor=[blue,red], stepsize=0.1)
])); |
| > |
|
| > |
| > | R:=0.1;
display( array([ DEplot(xphug, [ theta(t), v(t), x(t), y(t) ], t=0..10, |
| > | [[theta(0)=0, v(0)=2.5, x(0)=0, y(0)=4 ],
[theta(0)=0, v(0)=.8, x(0)=0, y(0)=1 ]], |
| > | theta=-Pi/2..3*Pi, v=0..3, x=-1..6, y=0..7,
scene=[theta,v], |
| > | linecolor=[blue,red], stepsize=0.1, title="v,theta phase"),
|
| > | DEplot(xphug, [ theta(t), v(t), x(t), y(t) ], t=0..10, |
| > | [[theta(0)=0, v(0)=2.5, x(0)=0, y(0)=4 ],
[theta(0)=0, v(0)=.8, x(0)=0, y(0)=1 ]], |
| > | theta=-Pi/2..3*Pi, v=0..3, x=-1..6, y=0..7,
scene=[x,y], title="path of glider", |
| > | linecolor=[blue,red], stepsize=0.1)
])); |
| > |
|
| > | R:=0.8;
display( array([ DEplot(xphug, [ theta(t), v(t), x(t), y(t) ], t=0..10, |
| > | [[theta(0)=0, v(0)=2.5, x(0)=0, y(0)=4 ],
[theta(0)=0, v(0)=.8, x(0)=0, y(0)=1 ]], |
| > | theta=-Pi/2..3*Pi, v=0..3, x=-1..6, y=0..7,
scene=[theta,v], |
| > | linecolor=[blue,red], stepsize=0.1, title="v,theta phase"),
|
| > | DEplot(xphug, [ theta(t), v(t), x(t), y(t) ], t=0..10, |
| > | [[theta(0)=0, v(0)=2.5, x(0)=0, y(0)=4 ],
[theta(0)=0, v(0)=.8, x(0)=0, y(0)=1 ]], |
| > | theta=-Pi/2..3*Pi, v=0..3, x=-1..6, y=0..7,
scene=[x,y], title="path of glider", |
| > | linecolor=[blue,red], stepsize=0.1)
])); |
| > |
|
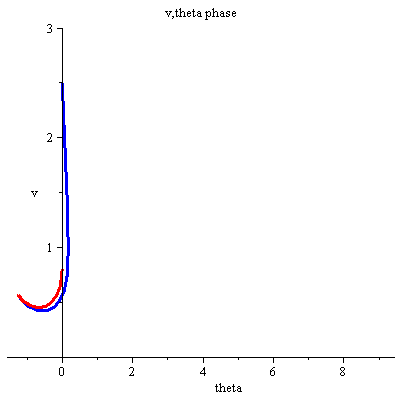
| > | R:=3;
display( array([ DEplot(xphug, [ theta(t), v(t), x(t), y(t) ], t=0..10, |
| > | [[theta(0)=0, v(0)=2.5, x(0)=0, y(0)=4 ],
[theta(0)=0, v(0)=.8, x(0)=0, y(0)=1 ]], |
| > | theta=-Pi/2..3*Pi, v=0..3, x=-1..6, y=0..7,
scene=[theta,v], |
| > | linecolor=[blue,red], stepsize=0.1, title="v,theta phase"),
|
| > | DEplot(xphug, [ theta(t), v(t), x(t), y(t) ], t=0..10, |
| > | [[theta(0)=0, v(0)=2.5, x(0)=0, y(0)=4 ],
[theta(0)=0, v(0)=.8, x(0)=0, y(0)=1 ]], |
| > | theta=-Pi/2..3*Pi, v=0..3, x=-1..6, y=0..7,
scene=[x,y], title="path of glider", |
| > | linecolor=[blue,red], stepsize=0.1)
])); |
| > |
| > |
|
| > |  |
| > | guts:= [ theta(t), v(t), x(t), y(t) ], t=0..10, |
| > | [[theta(0)=0, v(0)=2.5, x(0)=0, y(0)=4 ],
[theta(0)=0, v(0)=.8, x(0)=0, y(0)=1 ], [theta(0)=0, v(0)=1, x(0)=0, y(0)=3 ]], |
| > | theta=-Pi/2..3*Pi, v=0..3, x=-1..6, y=0..7, |
| > | linecolor=[blue,red, black], stepsize=0.1: |
| > |
| > | R:=0;
display( array([ DEplot(xphug, guts, scene=[theta,v],title="v,theta phase"), DEplot(xphug, guts, scene=[x,y],title="glider path")])); |
| > |
| > |
|
| > | guts:= [ theta(t), v(t), x(t), y(t) ], t=0..10, |
| > | [seq( [theta(0)=0, v(0)=1+i/10, x(0)=0, y(0)=i+.1 ], i=0..10)], |
| > | theta=-Pi/2..3*Pi, v=0..3, x=-1..6, y=0..13, |
| > | linecolor=[seq(COLOR(HUE,i/10),i=0..10)], stepsize=0.1: |
| > |
| > | R:=0;
display( array([ DEplot(xphug, guts, scene=[theta,v],title="v,theta phase"), DEplot(xphug, guts, scene=[x,y],title="glider path")])); |
|
| > |