| > | 2+2; |
| (1) |
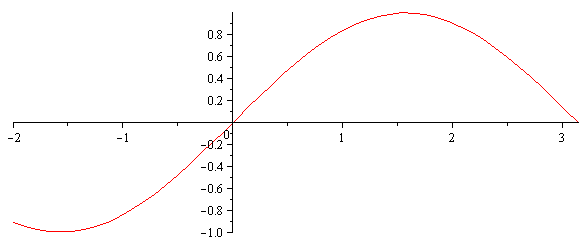
| > | plot(sin(x),x=-2..Pi); |
 |
| > |
| > | int(sin(2*x)*cos(x),x); |
| (2) |
| > |
| > | diff(exp(cos(3*x)),x); |
| (3) |
| > | factor( x^3-1); |
| (4) |
| > | ifactor(1234567890); |
| (5) |
| > |
| > |
| > | sqrt(9); |
| (6) |
| > | sqrt(10); |
| (7) |
| > | evalf(%); |
| (8) |
| > | evalf(Pi,200); |
| (9) |
| > | Digits:=27; |
| (10) |
| > | evalf(Pi); |
| (11) |
| > | 2^31; |
| (12) |
| > | 2/3; |
| (13) |
| > | 2.0/3; |
| (14) |
| > | int(cos(exp(x)),x); |
| (15) |
| > | int(cos(exp(x)),x=0..5); |
| (16) |
| > | evalf(%); |
| (17) |
| > | int(cos(e^x),x); |
| (18) |
| > | e:= exp(1); |
| (19) |
| > | int(cos(e^x),x); |
| (20) |
| > | joe = 7; |
| (21) |
| > | joe:=int(exp(cos(x)),x); |
| (22) |
| > | diff(joe,x); |
| (23) |
| > | plot( x^2 + y^3, x=-1..1, y=-1..1); |
| Warning, unable to evaluate the function to numeric values in the region; see the plotting command's help page to ensure the calling sequence is correct | |
 |
| > | ?plot |
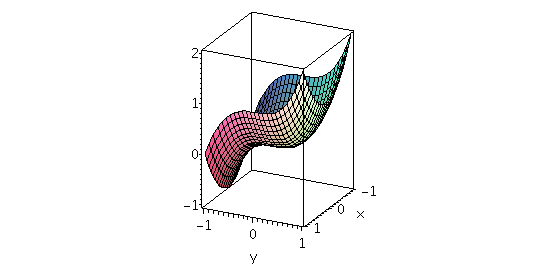
| > | plot3d( x^2 + y^3, x=-1..1, y=-1..1, axes=boxed, scaling=constrained); |
 |
| > | plot(sin(1/x),x=0..Pi); |
 |
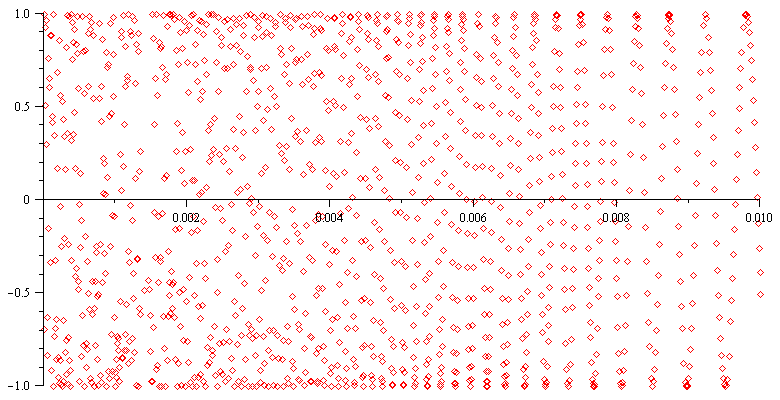
| > | plot(sin(1/x),x=0..0.01); |
 |
| > |