John Venn (1834-1923) was a British mathematician and logician; he is best known today for the diagrams that bear his name. In this column we will review the use of Venn diagrams, and see why planar Venn diagrams involving four or more statements cannot give a topologically satisfactory picture of the way the various combinations of the statements are logically related.
A Venn diagram is a graphical way of illustrating the calculus of logical functions. These are functions which assign to a statement a truth-value: 0 ("false") or 1 ("true"). What is calculated is how these functions combine under the fundamental operations and, or and not, where these are defined by
So the meaning of and, or and not corresponds to the usual meaning of the words, except that or means "or" not in the sense of "Are you coming or going?" but in the sense of "You must be delusional or misinformed," where the possibility of both is not excluded.
The definitions above can be encapsulated in tables organized like multiplication and addition tables:
|
|
|
For example not(A or(B and not C)) = not A and (not B or C) is a "tautology" (i.e., the values of the left and right-hand sides are equal for any combination of values of A, B, C). One algorithmic way of checking that we really have a tautology is to use truth tables: tabulate the truth-value of the left side for all possible combinations of A, B, C truth-values (there are 2 x 2 x 2 = 8 of them), do the same for the right side, and check that the outputs are always the same.
The left side works out as
| A | B | C | not C | B and not C |
A or (B and not C) |
not(A or (B and not C)) |
| 0 | 0 | 0 | 1 | 0 | 0 | 1 |
| 0 | 0 | 1 | 0 | 0 | 0 | 1 |
| 0 | 1 | 0 | 1 | 1 | 1 | 0 |
| 0 | 1 | 1 | 0 | 0 | 0 | 1 |
| 1 | 0 | 0 | 1 | 0 | 1 | 0 |
| 1 | 0 | 1 | 0 | 0 | 1 | 0 |
| 1 | 1 | 0 | 1 | 0 | 1 | 0 |
| 1 | 1 | 1 | 0 | 1 | 1 | 0 |
while the right side is
| A | B | C | not B | not B or C |
not A | not A and (not B or C) |
| 0 | 0 | 0 | 1 | 1 | 1 | 1 |
| 0 | 0 | 1 | 1 | 1 | 1 | 1 |
| 0 | 1 | 0 | 0 | 0 | 1 | 0 |
| 0 | 1 | 1 | 0 | 1 | 1 | 1 |
| 1 | 0 | 0 | 1 | 1 | 0 | 0 |
| 1 | 0 | 1 | 1 | 1 | 0 | 0 |
| 1 | 1 | 0 | 0 | 0 | 0 | 0 |
| 1 | 1 | 1 | 0 | 0 | 0 | 0 |
and since the two last columns match, the two statements are equivalent.
There is a graphical way of interpreting truth tables, based on the parallelism between and, or, not and the operations intersection, union, complement in set theory. The parallelism is built into the definitions of the set-theoretic operations, since X intersect Y is the set of elements which belong to X and to Y, X union Y is the set of elements which belong to X or to Y, and the complement of X is the set of elements which do not belong to X.
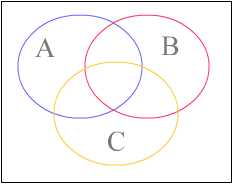
For logical purposes we can identify a statement A with the set of instances in which A is true; then logical operations on statements are exactly set-theoretic operations on the corresponding sets. The Venn-diagram idea is to represent the sets by shapes in the plane, and to reason thereby.
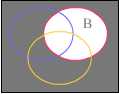
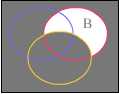
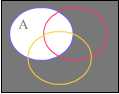
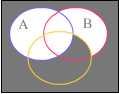
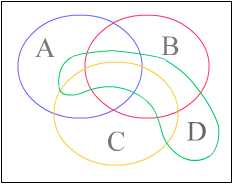
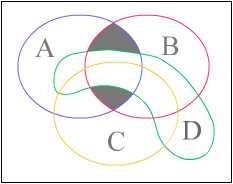
To repeat the previous example in this new format, we represent the set corresponding to statement A by the set of points inside a (blue) circle, and likewise for B (yellow) and for C (red), and we position these circles so that all possible intersections occur. The three circles sit inside a box which represents the universe, or the set of all possible instances, so that the region outside the blue circle represents the statement not A, etc.
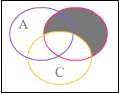
We can construct the region corresponding to the statement not(A or(B and not C)) stepwise just as we calculated the truth table:
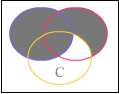

Similarly we can graphically duplicate the truth-table computation of not A and (not B or C):
Visual comparison of the two final images shows that the two sets, and therefore the two statements, are equivalent.
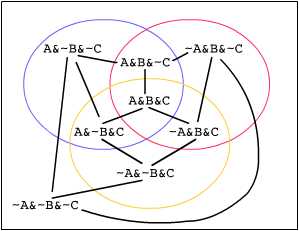
In the three-statement Venn diagram, the three circles and the region outside them partition the "universe" into eight regions. Each region can be characterized by whether its points are inside or outside A, B or C: each region corresponds to a unique threefold and, running from not A and not B and not C (the outside) to A and B and C (the innermost). The usual name for these expressions is conjunctions or, in analogy with multiplication, monomials. Furthermore, in the three-statement Venn diagram, the relative topology of these regions mirrors the relative closeness of the corresponding monomials, in the following precise sense: if two monomials differ by switching one statement to its negation, the two corresponding regions share a common edge. We will call such a Venn diagram topologically faithful. Topologically faithful diagrams exist for one, two or three statements, but not if the number of statements is four or more; the non-existence is proved in the Appendix.
A 4-statement topologically faithful Venn diagram cannot be drawn in the plane, but an analogous structure does exist in three dimensions:
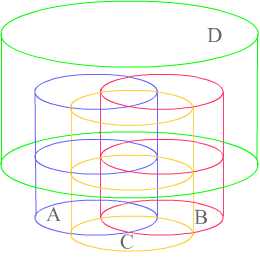
This construction can be repeated to give a topologically faithful four-dimensional "Venn diagram" for five statements, etc.
In the planar 3-statement Venn diagram, let us label a point in each of the eight regions by the corresponding monomial, and draw a line segment between two of these points if the regions share a side. The graph thus obtained is the dual graph of the partition into regions; by its construction no two edges intersect. The graph itself can be redrawn as the vertices and edges of a cube, with displacement in the x-direction corresponding to A <--> not A adjacency of the corresponding regions, displacement in the y-direction corresponding to B <--> not B adjacency, and displacement in the z-direction corresponding to C <--> not C adjacency.

In a topologically faithful Venn diagram for the 4 statements A,B,C,D, the dual graph will have 16 vertices, labeled from not A and not B and not C and not D up to A and B and C and D. Each region must share an edge with exactly four other regions, since there are 4 places where "not" can be inserted or eliminated. Correspondingly, the dual graph would have to show 4 possible directions at each vertex; this gives the graph of edges of a 4-dimensional cube.
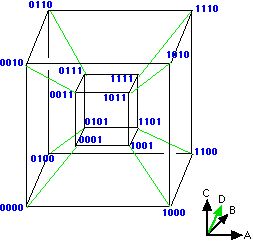
If a perfect Venn diagram for 4 logical variables could be drawn in the plane, then the dual graph, the graph of edges of the 4-cube, could also be drawn in the plane, with no intersections of edges; just as happened with the 3-variable Venn diagram and the graph of edges of the 3-cube.
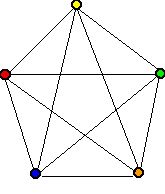
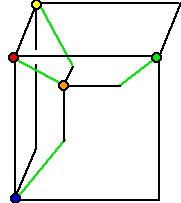
This is impossible, because the graph of edges of the 4-cube contains K5, the complete graph on 5 vertices. ("Complete" means that each has an edge joining it to the other four). The next two images show K5 and its embedding as a subgraph of the graph of edges of the 4-cube.
|
|
Here is where the contradiction can be identified: the graph K5 cannot be drawn in the plane without two of its edges intersecting. The usual proof of this fact uses the Jordan Curve Theorem (every simple closed curve divides the plane into two regions, one "inside" the curve, and one "outside") and Euler's Theorem (if V, E and F are the numbers of vertices, edges and faces of a planar graph, then V - E + F = 1). Here is a more rudimentary argument.
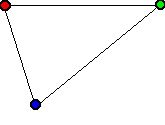
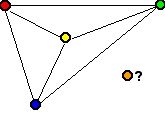
The first three vertices of K5 share three edges which form a triangle. By the Jordan Curve Theorem (we only need it for curvilinear polygons; much simpler to prove than the general statement), the triangle divides the plane into an inside and an outside. Suppose the fourth vertex goes inside. Then its edges to the first three vertices divide that triangle into three regions. Now there is nowhere to put the fifth vertex. If it is outside, it cannot be connected to the fourth, but if it is inside it must lie in one of the three triangles. That triangle will use vertex four and two of the original vertices, but then the fifth vertex will not be connectible to the remaining original vertex.
|
|