Mat 331
Exercise 3: Some Elementary Maple
1. Evaluate
![]() to 30 decimal places.
to 30 decimal places.
> evalf(Pi^(sqrt(2)),30);
![]()
2. Consider the function
![[Maple Math]](solutions33.gif)
>
f:= x-> (sqrt(x)*(-116*x^3+8*x^4+558*x^2-891*x))/
(2*x^5-29*x^4+140*x^3-225*x^2);
![[Maple Math]](solutions34.gif)
a. Write this in a simpler form (that is, factor and reduce it).
> factor(f(x));
![]()
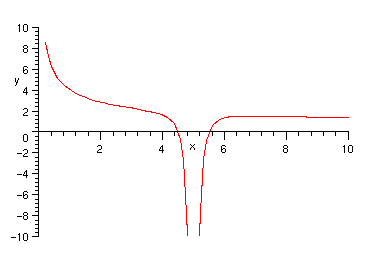
b. Draw the graph of the function for
![]() between 0 and 10. Adjust the vertical range so some detail can be seen.
between 0 and 10. Adjust the vertical range so some detail can be seen.
> plot(f(x),x=0..10);
That looks terrible (too much range is wasted on the asymptote at
![]() ), so lets try looking at a restricted range, as suggested. After a bit of playing around, it seems that the following works well, indicating both the asymptotes at
), so lets try looking at a restricted range, as suggested. After a bit of playing around, it seems that the following works well, indicating both the asymptotes at
![]() and
and
![]() , but also some of the detail when
, but also some of the detail when
![]() is between
is between
![]() and
and
![]() or so.
or so.
> plot(f(x),x=0..10,y=-10..10);
c. Compute the area of the part of the curve that lies above the
![]() -axis and between
-axis and between
![]() and
and
![]() (i.e., integrate the function over the appropriate range of
(i.e., integrate the function over the appropriate range of
![]() values). Give your answer both in an exact form and as a decimal approximation to about 10 places.
values). Give your answer both in an exact form and as a decimal approximation to about 10 places.
First, we need to notice where the function crosses the
![]() -axis. This is easily seen to be where
-axis. This is easily seen to be where
![]() from the answer to part
a
, but we could also let maple do all the work:
from the answer to part
a
, but we could also let maple do all the work:
> solve(f(x)=0,x);
![]()
Now that we have that, the rest is straightforward.
> int(f(x),x=0..9/2);
![]()
> evalf(%);
![]()
d. What is the value of the integral if you remove the factor of
![]() from the numerator?
from the numerator?
This is most simply expressed as
![]() , but of course there are many other ways to do it.
, but of course there are many other ways to do it.
> int(f(x)/sqrt(x),x=0..9/2);
![]()
The answer is infinite, because the new function looks like
![]() near
near
![]() , which is does not bound a finite area (unlike
, which is does not bound a finite area (unlike
![]() ).
).
e. Use the derivative of
![]() to determine for what real
to determine for what real
![]() the function has a local maximum. An approximation to about 8 decimal places is sufficient.
the function has a local maximum. An approximation to about 8 decimal places is sufficient.
We can do this all in one maple statement, supressing all the intermediate messiness. Note that we don't care what the derivative is, only where it is zero. Also, we know from the graph in part b that the answer is about 6, and that it is clearly a local maximum, so we needn't mess with second derivatives, although we could if we really wanted to.
> evalf( solve ( diff(f(x),x)=0, x));
![]()
There are three critical points, but only one of them is a real number; the others are complex. So the maximum occurs at
> [6.952224567, f(6.952224567)];
![]()
3. Use the commands seq and ithprime generate a list of the first 20 primes. Compute the sum of the first 20 primes, and give its integer factors.
> seq(ithprime(i),i=1..20);
![]()
> sumprimes:= sum(ithprime(i),i=1..20);
![]()
> ifactor(sumprimes);
![]()
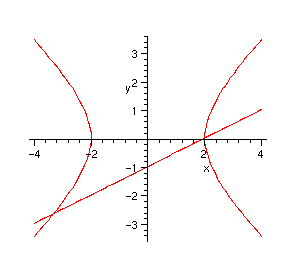
4. Find the solutions to the system of equations
![]() .
.
> solve({x^2-y^2=4, x-2*y=2},{x,y});
![]()
We should, of course, expect two solutions, because this is the intersection of a hyperbola and a line.
> plots[implicitplot]({x^2-y^2=4, x-2*y=2},x=-4..4,y=-4..4);
>
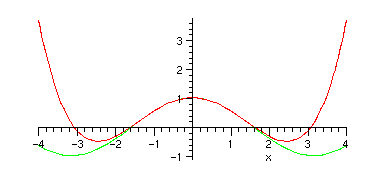
5. Draw a graph showing both cos(x) and its fifth taylor polynomial (that is,
![[Maple Math]](solutions340.gif) ) for
) for
![]() between
between
![]() and 4. How many terms do you seem to need to get ``good agreement'' in this range (you will need to use something like
convert(taylor(cos(x),x,5), polynom)
to make this work. You should think about an appropriate way to demonstrate that the approximation you've taken is ``good''.
and 4. How many terms do you seem to need to get ``good agreement'' in this range (you will need to use something like
convert(taylor(cos(x),x,5), polynom)
to make this work. You should think about an appropriate way to demonstrate that the approximation you've taken is ``good''.
Note that the command taylor() gives us an object which is a series, rather than a polynomial, that is, it has an order of trunctation with it. Thus the result of taylor() cannot be plotted directly:
> taylor(cos(x),x,5);
![]()
> plot(%);
Plotting error, empty plot
So, to get around that, we can use
convert()
to discard the
![]() term and give us a polynomial.
term and give us a polynomial.
Here are the two functions together:
> plot({cos(x),convert(taylor(cos(x),x,5), polynom)},x=-4..4);
Now, we could just keep making that picture, increasing the number of terms by two (every other term in the taylor series of cosine is 0) until it looks good. But, we might as well be a bit fancier and do it all at once. Since I will need it later, I am also going to define a function which gives me the
![]() series.
series.
> nthseries := n -> convert( taylor(cos(x),x,n), polynom);
![]()
Now I will plot the cosine and several of the approximations on the same graph, and see which looks good. I'll use
seq()
to generate them. (Note that since I only want odd numbers, I will index them by
![]() so the
so the
![]() polynomial will correspond to i=2. That is, we are giving the number of non-constant terms rather than the order).
polynomial will correspond to i=2. That is, we are giving the number of non-constant terms rather than the order).
We can see a bit better what is going on if we look at a slightly different domain and range.
> plot([cos(x), seq(nthseries(2*i+1),i=1..7)],x=0..6,y=-1..1);
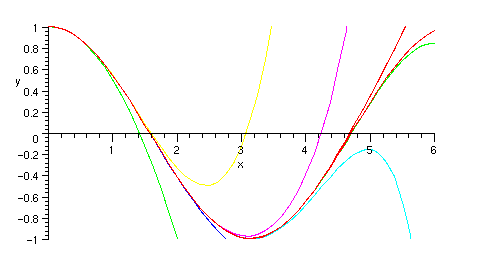
Note that all of the series fit well near x=0, but the last two (
![]() and
and
![]() ) have graphs which are visually indistinguishable from the cosine while
) have graphs which are visually indistinguishable from the cosine while
![]() . The graph below demonstrates that
. The graph below demonstrates that
![]() gives a "good" fit over the desired range, since it seems we are plotting only one function.
gives a "good" fit over the desired range, since it seems we are plotting only one function.
> plot([cos(x), nthseries(13)],x=-4..4);
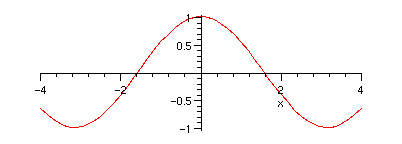
However, plotting the difference of the two is a better indication of the goodness of fit:
> plot(nthseries(13)-cos(x),x=-4..4);
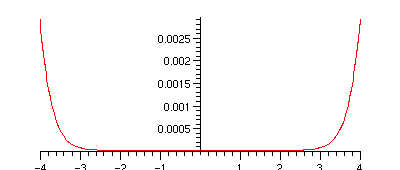
Truncating at
![]() gives us agreement over the whole range to within 0.003, which is pretty good.
gives us agreement over the whole range to within 0.003, which is pretty good.
There are, of course, many other measures of "good".
>