2. In polar coordinates
If the circle is centered at the origin, it is, in some sense, most naturally expressed in polar coordinates, as
![]() . If the center is not at the origin, things are a bit messier, but not too bad. Recall that polar coordinates represent a point in the plane in terms of its distance from the origin (usually represented as
. If the center is not at the origin, things are a bit messier, but not too bad. Recall that polar coordinates represent a point in the plane in terms of its distance from the origin (usually represented as
![]() ) and the angle
) and the angle
![]() it makes with the positive
it makes with the positive
![]() -axis (measured counterclockwise). Thus, from elementary trigonometry, we have
-axis (measured counterclockwise). Thus, from elementary trigonometry, we have
![]() and
and
![]() .
.
Making this change gives us the following:
> subs(x=r*cos(theta),y=r*sin(theta),circleEqn);
![]()
which isn't too bad... Since we usually try to represent a polar function as
![]() , we can solve for
, we can solve for
![]() to obtain the following.
to obtain the following.
> polarcirc:=solve(%,r);
![]()
![]()
This is really rather dreadful looking, but notice that if
![]() and
and
![]() are both zero, the first simplifies to
are both zero, the first simplifies to
![]() and the second becomes
and the second becomes
![]() . On closer examination, you can see that if the circle surrounds the origin, (that is
. On closer examination, you can see that if the circle surrounds the origin, (that is
![]() ), then the second always corresponds to negative values of the radius, and can be ignored for our purposes. Again, since we want to use
), then the second always corresponds to negative values of the radius, and can be ignored for our purposes. Again, since we want to use
![]() , we substitute into the first one.
, we substitute into the first one.
> mypolarcirc:= subs(a=2,b=1,R=3,polarcirc[1]);
![]()
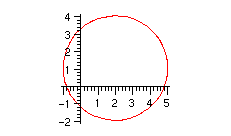
To plot it, we just tell maple that we are using polar coordinates. We need to allow theta to range over the whole circle, of course.
> plot(mypolarcirc,theta=0..2*Pi,coords=polar);

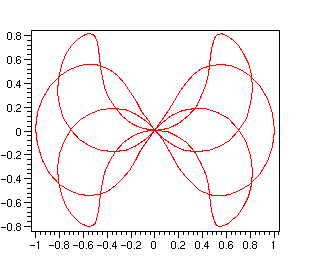
I should point out that maple can also do parametric polar plots, where both the radius and angle are functions of a parameter
![]() , for example, we can make a "butterfly" with something like
, for example, we can make a "butterfly" with something like
> plot([cos(3*t),sin(4*t),t=0..2*Pi], coords=polar, axes=boxed,scaling=constrained);

This, of course, has nothing to do with plotting a circle, but is fun anyway.