Here we shall discuss using maple to fit a line to some data, using least-squares.
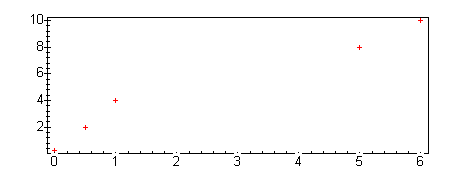
First, lets type in our data to fit
pts := [ [0,0.25], [1/2,2], [1,4], [5,8], [6,10] ];
              pts := [[0, .25], [1/2, 2], [1, 4], [5, 8], [6, 10]]

plot(pts,style=point, axes=boxed);
We could use maple's built-in regression package to find the answer, but that wouldn't help much in explaining what's going on. Let's do it anyway, though.
Note that the least-squares package wants the x values and y values in separate lists, so we have to adjust them a bit.
with(stats):
fit[leastsquare[[x,y]]]([[ pts[i][1] $ i=1..5 ], [pts[i][2] $i=1..5]]);
                         y = 1.271370968 + 1.431451613 x
Let's do the same thing ourselves, "by hand".
First, lets define the "error functional" which gives us the distance from a line (actually, its coefficients) to the data.
 F := (m,b) -> sum(  (  (m*pts[i][1] + b)  - pts[i][2] ) ^2,
                                    i=1..5);

                               5
                             -----
                              \                                 2
               F := (m,b) ->   )   (m pts[i][1] + b - pts[i][2])
                              /
                             -----
                             i = 1
For example, if we guessed that the line was y= 2x + 1, we could compute its distance:
F(2,1);
                                     19.5625
but we see that decreasing the slope and increasing the intercept gives a better fit:
 F(1.5,1.2);
                                   3.125000000
Now we want to minimize this quantity. Note that maple will happily compute the partial derivatives for us.
 diff ( F(m,b), m);
                              249/2 m + 25 b - 210
So, we can ask maple to solve, setting each of the partials to 0.
 solve( { diff ( F(m,b), m)=0  , diff ( F(m,b), b) = 0},
              {m, b} );
                       {b = 1.271370968, m = 1.431451613}
Not surprisingly, this was the same solution we got before. If we now want to use this value of m and b without retyping it, we can use maple's assign command to let b and m be constants with the values given.
assign(");
Maple just does the assignment, but doesn't say anything... But, m and b are now constants, with values of about 1.43 and 1.27, respectively.
m;
                                   1.431451613
If we want, we can compute the distance of this line to the points...
 F(m, b);
                                   2.929334677
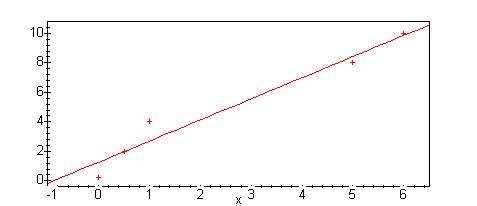
To get an idea of how good our fit is, we can make a plot with the data points and the line on the same graph. We first need to load the 'plots' package, so we can use 'display'.
with(plots):
We can now compute both plots, and use display to show them together. Note that we use a : to supress the output of the plot calls.
lplot := plot(m*x+ b, x=-1..6.5, axes=boxed):
pplot:= plot(pts, style=point):
display({lplot, pplot});
One minor point:
Since we defined 'm' and 'b' to be constants, we can no longer treat them as variables. For example, the statement we used before
to compute the derivative of F with respect to m no longer works, since it is asking maple to compute the derivative of 2.929334677
with respect to 1.431451613. This, of course, makes no sense.
 diff(F(m,b),m);
Error, wrong number (or type) of parameters in function diff
Of course, we can do this by substituting in other variables
 diff(F(n,c),n);

                              249/2 n + 25 c - 210
Alternatively, we can tell maple to "forget" the previous definitions of m and b:
 m:='m';
b:='b';

                                     m := m

                                     b := b

diff(F(m,b),m);

                              249/2 m + 25 b - 210