Project 2: Least-Squares Fitting to Data
Due Monday, October 21
In this project, we will look at a common method of fitting a curve to data, called ``least squares''. Usually, this is done to fit a line to experimental data, but to make things more interesting, you get to fit a circle to some data. This is a bit trickier, but I will give hints. First, we review the least-squares process.
We start out with a collection of data points ![]() which are
believed to approximate some functional relationship. (For definiteness, I
will stick to points in the plane, although the process works the same for an
arbitrary dimension.) Most commonly, this functional relation is a line,
that is,
which are
believed to approximate some functional relationship. (For definiteness, I
will stick to points in the plane, although the process works the same for an
arbitrary dimension.) Most commonly, this functional relation is a line,
that is, ![]() , where m and b are constants to be
determined.
, where m and b are constants to be
determined.
We then define an error functional which measures the ``distance'' from an
arbitrary choice of coefficients to our data. In least-squares fitting,
this ``distance'' is the sum of the squares of the distances from each data
point to the target function. One often assumes that the error only occurs
in the value of the dependent variable (the ![]() ), so the resulting error
functional is
), so the resulting error
functional is
![]()
Note that since the values of ![]() and
and ![]() are known, F depends on the
coefficients of the function we're trying to fit (in this case m and b).
To be a good distance function, F should be non-negative, and
should be 0 if and only if the data fits exactly.
are known, F depends on the
coefficients of the function we're trying to fit (in this case m and b).
To be a good distance function, F should be non-negative, and
should be 0 if and only if the data fits exactly.
Now the goal is to find the global minimum of the distance functional F. We do this by looking its critical points, which comes down to solving
![]()
simultaneously. Since F is quadratic in m and b, the resulting equations are linear, and there is a unique solution, which is the minimum. It should be clear that this is a minimum in this case, but you might want to convince yourself of that. This then gives us the coefficients of the desired line.
For fitting a circle, we have to modify things a bit. First, recall that the general equation of a circle centered at (a,b) with a radius of r is
![]()
We will assume that we are given data points ![]() to fit. Unlike the
linear case, there is no independent variable (we could try to use
to fit. Unlike the
linear case, there is no independent variable (we could try to use ![]() ,
but this would bias things badly; do you see why?). Nevertheless, we press
on.
,
but this would bias things badly; do you see why?). Nevertheless, we press
on.
One reasonable distance functional to choose is the ``area difference'', that is
![]()
A minor problem with this is that this is not quadratic in a, b,
and r (the degree is 4), and so the resulting equations are not
linear. Note, however, that if we let ![]() , the resulting
functional H(a,b,k) is quadratic, and we obtain the equations
, the resulting
functional H(a,b,k) is quadratic, and we obtain the equations
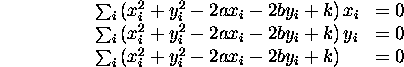
Solving these simultaneously gives us the a, b, and k, and from which we can readily determine the center and radius.
In this project, your assignment consists of two parts, one expository and the other computational.
For the expository piece, I would like you to develop and describe in some
detail the least-squares process for the circle outlined briefly above.
This should take you a page or two. At a minimum, should derive the above
linear equations and explain why the give the ``best'' circle. You might
want to consider the question of whether the minimum of the functional H
given above is the same as that of G, discuss other possible distance
functionals, and/or the problems with trying to fit either
![]() or parametric or polar equations. You
should decide exactly what topics to cover. This portion will be graded on
mathematical correctness, clarity of exposition, and the relevance of choice
of material. You need not type it as long as your handwriting is neat and
legible.
or parametric or polar equations. You
should decide exactly what topics to cover. This portion will be graded on
mathematical correctness, clarity of exposition, and the relevance of choice
of material. You need not type it as long as your handwriting is neat and
legible.
For the computational portion, you will be given three sets of data, called line1, circ1, and circ2. The first two contain 10 (x,y) pairs, and the last contains 100 pairs. You should read these into maple, and the determine the line that best fits line1, and the circle that fits circ1 and circ2. You should turn in a maple session that shows how you did this (you may use the built-in fit[leastsquare] function for the line if you want, but it won't work for the circle- can you see why not?). It would be nice to include a picture which shows how well your answer fits the data.
If you are feeling adventurous, you may also want to try fitting the data using other distance functionals. This is not required, but might be enlightening.
Each person will be mailed a set of data which is suitable for reading into maple. This data is also available on the webpage, stored under your last name. Feel free to use other people's data for testing.
As always, you may collaborate on your efforts, but your expository portion must be your own, and, since you each have different data to fit, so must your computational part.