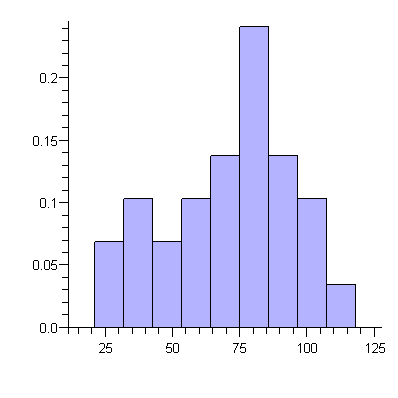
| > | final:=[62,53,25,83,88,77,47,104.5,57,82,65,58,99,118,34,65,100.5,69,85,38,88,85,21,79.5,75,90,91,69,38]; |
| > |
| > |
| > |
![]()
![]()
| > | with(stats):
with(stats[statplots]): with(Statistics): |
Warning, these names have been redefined: anova, describe, fit, importdata, random, statevalf, statplots, transform
Warning, these names have been redefined: boxplot, histogram, scatterplot, xscale, xshift, xyexchange, xzexchange, yscale, yshift, yzexchange, zscale, zshift
| > |
| > |
| > | histogram(final, area=1, numbars=9); |

| > | evalf(describe[mean](final)); |
![]()
The average score was 70.6 (Perfect score was 119)
Test score |
Grade |
Approx % students |
100-119 |
A |
10 |
90-100 |
A- |
10 |
70-89 |
B+, B, B- |
33 |
50-70 |
C, C+ |
30 |
25-50 |
C- |
10 |
0-25 |
D |
7 |
| > |