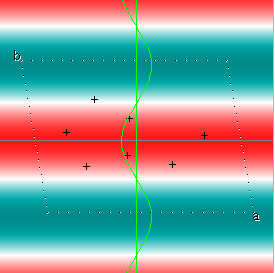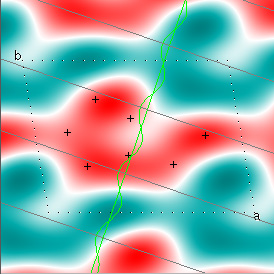
The temperature distributions $f(x) = \cos ~x + \cos~3x$ (red) and $g(x) = \cos ~x - \cos~3x$ (blue), on a circular loop of circumference $2\pi$ (plotted radially) are quite different but have Fourier coefficients with the same absolute values.
X-ray crystallography has been essential, since the beginning
of the 20th century, to our understanding
of matter; recently, as knowledge of the chemical composition
of proteins has progressed, the determination of their 3-dimensional
structure has become indispensable for the correct interpretation
of their functions. Our main access to this information is X-ray
crystallography. (X-rays are used because their wavelengths are
on the order of inter-atomic distances in molecules, in the
range 1-100 Å ; one Å is $10^{-10}$m). Mathematics
enters into the process at two stages. The study of
space groups tells what periodic configurations are
possible in three-space; in fact these are often called
"crystallographic groups" by mathematicians. The other connection,
the subject of this column, is the surprising and pleasing
fact that when a monochomatic X-ray diffracts off a crystal
it performs part of a mathematical operation: the Fourier
transform (developed in the 19th century in completely different
contexts); when the incidence angle is varied, the complete
transform is produced. The flaw in this lovely picture is that
we cannot measure all the details of the diffracted wave;
otherwise the entire molecular structure could be calculated
by inverting the Fourier transform.
There are many online resources devoted to
X-ray crystallography; I have especially profited from
Randy Read's Protein Crystallography Course and from Kevin Cowtan's
Interactive
Structure Factor Tutorial. Thanks also to my Stony Brook colleagues
Peter Stephens and Miguel Garcia-Diaz for helpful correspondence
and remarks.
Fourier series and the Fourier transform were invented as a method of data analysis. For example, let us follow Jean-Baptiste Joseph Fourier (1768-1830) in studying the time evolution of the temperature distribution in a circular loop of circumference $a$, given an initial distribution of temperature $f(x), 0\leq x\leq a$; (we require $f(a)= f(0)$). We start by calculating what are now known as the Fourier coefficients of $f$: $$a_0 = \frac{1}{a}\int_0^af(x)~dx,$$ $$a_h = \frac{2}{a}\int_0^af(x)\cos~ \frac{2\pi h}{a}x~dx,$$ $$b_h = \frac{2}{a}\int_0^af(x)\sin~ \frac{2\pi h}{a}x~dx.$$ It can be proved, if $f$ is sufficiently well-behaved, that the linear combination $$a_0 +\sum_{h=1}^{\infty}a_h\cos~ \frac{2\pi h}{a}x + \sum_{h=1}^{\infty}b_h\sin~ \frac{2\pi h}{a}x$$ (the Fourier series of $f$; when $a=2\pi$ these formulas simplify pleasantly) converges everywhere to $f(x)$.
(Taken as an initial distribution separately, each of the $\cos~ \frac{2\pi h}{a}x$ and $\sin~ \frac{2\pi h}{a}x$ functions determines a simple solution, as does a constant function; the linearity of the heat equation allows these separate solutions to be combined, with coefficients $a_h$ and $b_h$, to give the complete solution to the problem.)
It is useful to simplify the formulas by using Euler's identities $\cos~ t = \frac{1}{2}(e^{it} + e^{-it})$, $\sin~ t = \frac{1}{2i}(e^{it} - e^{-it})$ and grouping terms to yield $$f(x) = \sum_{h=-\infty}^{\infty}c_h e^{i\frac{2\pi h}{a}x}$$ and $$c_h = \frac{1}{a}\int_0^a f(x)~e^{-i\frac{2\pi h}{a}x}~dx;$$ in general, the $c_h$ are complex numbers.
The dual operations of integration: $f(x)~\rightarrow~ \{c_h\}$ and summation: $\{c_h\}~\rightarrow~f(x)$ can be realized in other contexts. In this column we will consider the function $\rho(x,y,z)$ that gives the electron density distribution in the crystalline state of some compound. Suppose, for simplicity, that the unit building block, corresponding to a molecule of the compound, is a rectangular solid; say with edge-lengths $a, b$ and $c$; these $a$ by $b$ by $c$ solids are stacked in three-space so as to give a structure repeating every $a$ units in the $x$-direction, every $b$ units in the $y$ and every $c$ units in the $z$. Then the function $\rho(x,y,z)$ will be triply periodic, with periods $a, b$ and $c$, and consequently can be represented as a triple Fourier series $$\rho(x,y,z) = \sum_{h=-\infty}^{\infty} \sum_{k=-\infty}^{\infty} \sum_{l=-\infty}^{\infty} c_{hkl}e^{i(\frac{2\pi h}{a}x + \frac{2\pi k}{b}y +\frac{2\pi l}{c}z)},$$ where $$c_{hkl}=\frac{1}{abc}\int_0^a\int_0^b\int_0^c \rho(x,y,z)e^{-i(\frac{2\pi h}{a}x + \frac{2\pi k}{b}y +\frac{2\pi l}{c}z)} ~dx~dy~dz,$$ directly generalizing our formulas for the circle. If the coefficients $c_{hkl}$ are known, the electron density distribution can be calculated, and then the structure of the molecule can be determined. It is therefore remarkable that the diffraction patterns formed when the crystal is bombarded with X-rays contain precious information about the $c_{hkl}$. Roughly speaking, we can imagine the complex numbers $c_{hkl}$ placed at the vertices $(h,k,l)$ of a 3-dimensional lattice; each X-ray diffraction pattern projects this lattice onto the plane of the image plate. If we label by $p_{\Theta}$ the projection produced by a beam meeting the crystal at a generalized angle $\Theta$, a vertex $(h,k,l)$ which is good position with respect to $\Theta$ (this condition also depends on the wavelength $\lambda$ of the radiation) will appear on the plate as a spot at location $p_{\Theta}(h,k,l)$ and of intensity proportional to the square of the absolute value $|c_{hkl}|$. Varying $\Theta$ will bring a new set of vertices into good position; eventually the lattice can be reconstructed, along with the absolute value of the coefficients at the vertices.
The temperature distributions $f(x) = \cos ~x + \cos~3x$ (red) and $g(x) = \cos ~x - \cos~3x$ (blue), on a circular loop of circumference $2\pi$ (plotted radially) are quite different but have Fourier coefficients with the same absolute values.
X-rays interact with a crystal through interaction with parallel families of planes. Suppose as before that the unit cell in the crystal is an $a\times b\times c$ rectangular parallelipiped (when $a,b$ and $c$ are all different, this structure is called orthorhombic). Every triple $(h,k,l)$ of integers defines a family of planes through the crystal, defined by the equation $$\frac{xh}{a}+ \frac{yk}{b}+\frac{zl}{c} = n ~~~~ (n \mbox{ an integer}).$$ Let us change coordinates to $X = \frac{x}{a}$, $Y=\frac{y}{b}$, $Z=\frac{z}{c}$. (We are now in the reciprocal lattice; for a non-rectangular crystal the change of coordinates is only slightly more complicated). Then the equation defining the planes becomes $$Xh+Yk+Zl=n,$$ for $n$ an integer. For each $(h,k,l)$ this family of parallel planes fills up the crystal, in the sense that each unit cell vertex lies in (exactly) one of them, as is easy to check. We call these the lattice planes. Graphically, it is easier to represent the analogous concept in two dimensions, so we suppress $z$ and $l$ for the moment. Our crystal is then an array of $a\times b$ rectangles; in the $(X,Y)$ coordinates these measure $1\times 1$. The pair $(0,1)$ gives the lines $Y = n$, for $n$ an integer. These lines are parallel to the $X$-axis, and slice through the base of each unit cell. On the other hand, $(1,1)$ gives the lines $X + Y = n$, or $Y = n -X$, $(-2,1)$ gives $Y = n + 2X$, and $(2,-3)$ gives $Y = -n/3 + (2/3)X$. (See image).
Lattice lines: the lines corresponding to $(1,1)$ are shown in blue, those for $(-2,1)$ in orange, and those for $(2,-3)$ in purple. Not all lines are shown.
X-ray diffraction: how a monochromatic plane wave performs Fourier analysis on the electron density distribution.
This diagram labels the vectors involved in
the calculation of diffraction. An incoming plane wave ${\bf k_0}$ diffracts
off an electron at $O$ as a wave ${\bf k}$ with the opposite incidence angle
$\theta$, and also off another electron at relative position ${\bf r}$.
The wave vectors ${\bf k_0}$ and ${\bf k}$ have the same magnitude, which
we set for convenience to be $\frac{1}{\lambda}$, the reciprocal of the
wavelength.
The diffracted rays travel different lengths: the path through $O'$
is longer by $AO' + O'B$ than the path through $O$, as shown. $AO'$
is the projection of ${\bf r}$ along ${\bf k_0}$ and has length
${\bf r}\cdot{\bf k_0}/|{\bf k_0}| = \lambda {\bf r}\cdot{\bf k_0}$.
$O'B$ is minus the projection of ${\bf r}$ along ${\bf k}$, and
so has length $-\lambda {\bf r}\cdot{\bf k}$. This gives, for
the difference in path lengths, $\lambda {\bf r}\cdot({\bf k_0}-{\bf k})$
or $\lambda {\bf r}\cdot{\bf s}$.
Since $\lambda$ is the wavelength,
the ray traveling through ${\bf r}$ will have its phase
retarded by $2\pi{\bf r}\cdot{\bf s}$; corresponding to a factor
$e^{-2\pi i {\bf r}\cdot{\bf s}}$.
The length of the vector ${\bf s}$ is $2|{\bf k}|
\sin\theta = 2\sin\theta/\lambda$
; so ${\bf r}\cdot{\bf s}$, which is equal to the component
of ${\bf r}$ in the direction of ${\bf s}$ times the length of ${\bf s}$,
is equal to $2d\sin\theta/\lambda$; constructive interference,
which corresponds to ${\bf r}\cdot{\bf s} = n$, an integer, thus also
corresponds to $2d\sin\theta = \lambda n$. This is Bragg's law;
its discovery in 1912 started the field of X-ray crystallography.
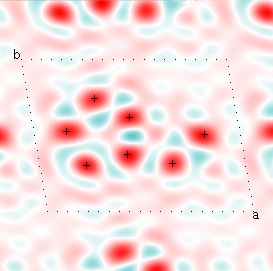
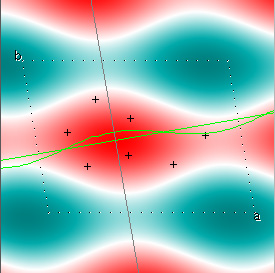
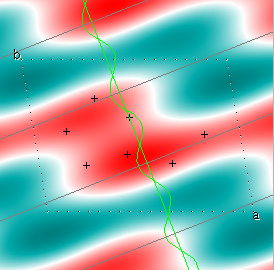
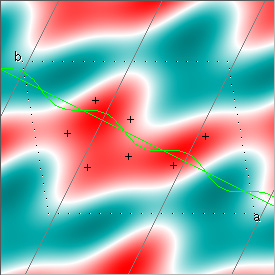
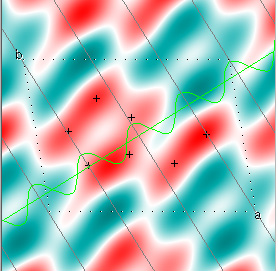
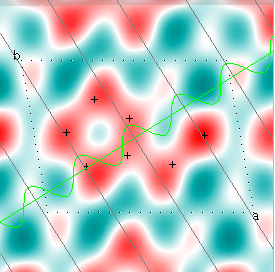
Cowtan's simulation leads to the approximate Fourier synthesis of the target from just the seven largest structure factors: those corresponding to $(h,k) = (0,1), (1,0), (-1,2), (-2,1), (1,2), (3,-2), (3,1)$. Here is how the synthesis proceeds, step by step, each time adding in the next structure factor. These images are from his tutorial, and are used with permission. The unit cell (not orthorhombic!) is outlined in dots.