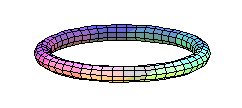
Maple also will do parametric plots in 3 dimensions. For the purposes of this discussion, we will focus on the Maple function tubeplot, which puts a tube around a curve in 3-space. Since tubeplot is part of the external package called plots, we can invoke it with a command such as
plots[tubeplot]([cos(t),sin(t),0,t=0..2*Pi], radius=0.1);

Alternatively, we can load the entire plots package, which defines a number of additional routines. After doing that, we need never identify that tubeplot is part of plots in the remainder of this session.
with(plots);

[animate, animate3d, changecoords, complexplot, complexplot3d,
    conformal, contourplot, contourplot3d, coordplot, coordplot3d,
    cylinderplot, densityplot, display, display3d, fieldplot,
    fieldplot3d, gradplot, gradplot3d, implicitplot, implicitplot3d,
    inequal, listcontplot, listcontplot3d, listdensityplot, listplot,
    listplot3d, loglogplot, logplot, matrixplot, odeplot, pareto,
    pointplot, pointplot3d, polarplot, polygonplot, polygonplot3d,
    polyhedraplot, replot, rootlocus, semilogplot, setoptions,
    setoptions3d, spacecurve, sparsematrixplot, sphereplot, surfdata,
    textplot, textplot3d, tubeplot]
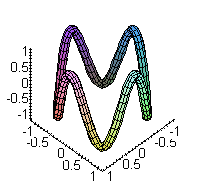
Now let's add a few bumps to the z-coordinate as we travel around the
circle.
tubeplot([cos(t), sin(t), cos(4*t)], t=0..2*Pi, radius=0.1,
         scaling=constrained, style=patch, numpoints=100, axes=framed);

We can also have the radius vary with the parameter, and/or have more than one "tube" at a time. Note that the radius of the "ring of beads" is sometimes negative... that's not a problem.
tubeplot({[cos(t), sin(t), 0, t=0..2*Pi,radius=.3*cos(4*t)],
          [t,-t,arctan(20*t), t=-1.5..1.5,radius=0.1]},
         style=patch, axes=none);
