4. Described implicitly
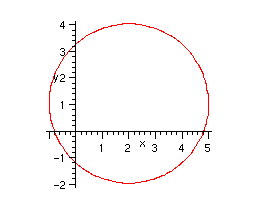
Maple can also plot the relation describing the circle implicitly. It has to work much harder in this case, and the results aren't always as nice. But the call is quite easy, although first we must load in the plots library.
> with(plots):
> implicitplot( (x-2)^2 + (y-1)^2= 3^2, x=-10..10, y=-10..10);

It is worth pointing out a few things here. First, notice that the circle looks a bit ragged. Also, note that I specified a rather large range for
![]() and
and
![]() (
(
![]() to
to
![]() ) but maple chose to only show a much smaller range. This is because of the way implicitplot works. The range we specify specifies not the desired plotting region, but where to search for solutions.
) but maple chose to only show a much smaller range. This is because of the way implicitplot works. The range we specify specifies not the desired plotting region, but where to search for solutions.
Maple chops up the region given into a number of subregions (50 by 50, unless you say otherwise) and searches for a solution in each of them. It then plots whatever it found, assuming it is connected "in a nice way". Sometimes it makes mistakes, of course.
We can greatly improve our picture by specifying a better search area.
> implicitplot( (x-2)^2 + (y-1)^2= 3^2, x=-1..5, y=-2..4);

Also, we can specify the number of points to search using the "grid" option. Rather than the circle, let's use a more complicated example to better show what goes wrong.
A trickier example of implicitplot.